
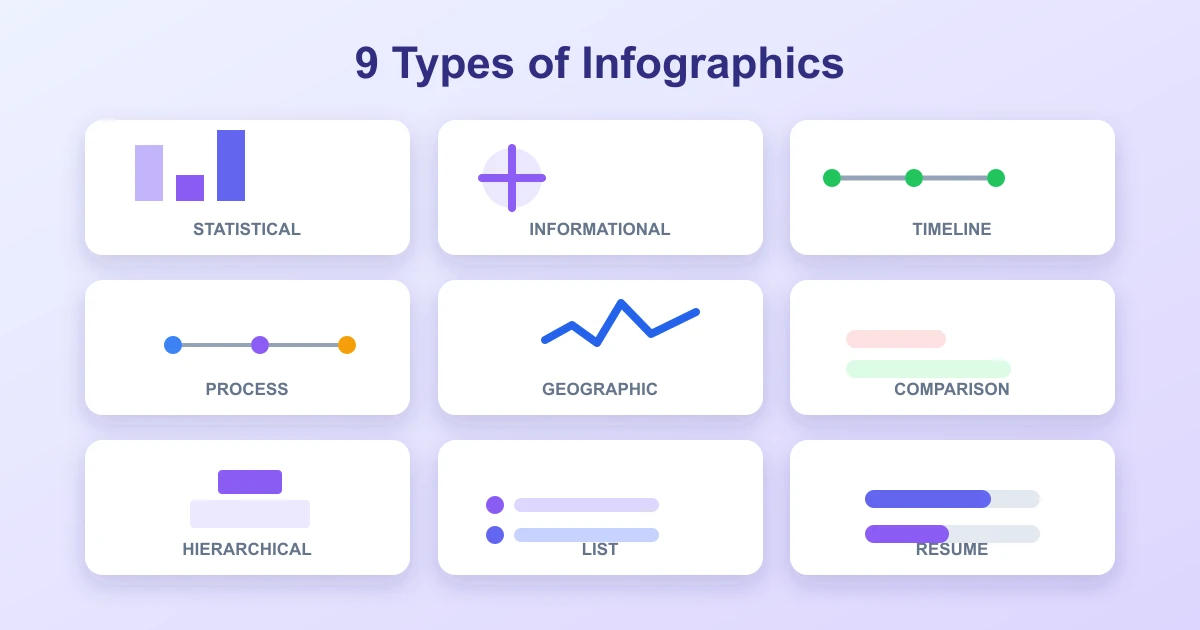
An infographic can organize facts, numbers, steps, locations, ideas, or categories. The best format depends on the relationship between those items and the point the reader should remember.
Quick answer
The 9 common infographic types are statistical, informational, timeline, process, geographic, comparison, hierarchical, list, and resume. Choose the type that matches your information structure, then use a template that keeps the reading order clear.
What are the 9 types of infographics?
1. Statistical infographic
A statistical infographic presents survey results, percentages, totals, or other numerical findings. Bar charts, pie charts, pictograms, large figures, and trend lines help readers compare values.
Best for: Research summaries, annual reports, surveys, product findings, and public data.
Template tip: Give one or two charts more space than supporting numbers. Every axis, unit, sample size, and source should remain visible.
2. Informational infographic
An informational infographic explains a topic, concept, system, or set of related facts. It usually uses short sections, icons, labeled diagrams, and a strong heading for each idea.
Best for: Definitions, background summaries, classroom material, customer education, and topic overviews.
Template tip: Use consistent cards or sections so each idea feels connected without repeating the same visual style.
3. Timeline infographic
A timeline infographic places events in chronological order. Dates, intervals, milestones, or phases can sit along a straight line, curve, or stacked sequence.
Best for: Company history, project schedules, historical events, product roadmaps, and progress reports.
Template tip: Keep date spacing consistent or label scale changes clearly. A crowded line becomes difficult to read.
4. Process infographic
A process infographic explains a sequence of actions or stages. Numbered steps, arrows, flow lines, icons, and short instructions guide the reader from start to finish.
Best for: Tutorials, onboarding, workflows, recipes, applications, troubleshooting, and service guides.
Template tip: Use directional cues in one consistent direction. Decision branches should be labeled and kept simple.
5. Geographic infographic
A geographic infographic adds location data to a map. Pins, color bands, bubbles, route lines, or region labels show how values differ across places.
Best for: Regional performance, distribution, travel routes, population patterns, climate data, and resource coverage.
Template tip: Include a legend and note the map projection or source if boundaries could affect interpretation.
6. Comparison infographic
A comparison infographic places two or more options side by side. Matching rows help readers scan prices, features, strengths, risks, or performance measures.
Best for: Product choices, plan differences, feature lists, before and after results, and balanced evaluations.
Template tip: Use the same row order and visual scale for every option. Avoid visual emphasis that suggests a winner before the facts do.
7. Hierarchical infographic
A hierarchical infographic shows levels, ranks, or authority. Pyramid, tree, nested circle, and organization chart layouts communicate which groups contain or depend on others.
Best for: Team structures, priority models, taxonomy, decision layers, and organizational relationships.
Template tip: Use color and size only to show meaningful rank or containment. Keep labels short enough to fit each level.
8. List infographic
A list infographic turns a ranked or grouped collection into a visual set. Each item may have an icon, number, short description, or illustration.
Best for: Tips, tools, benefits, steps, resources, examples, checklists, and curated collections.
Template tip: Vary item length minimally. A numbered sequence helps when the order matters; a neutral grid works better when it does not.
9. Resume infographic
A resume infographic presents skills, experience, education, or career progress in visual form. Charts, timelines, icons, and skill ratings can make a professional profile easier to scan.
Best for: Portfolios, personal profiles, conference handouts, creative job applications, and networking materials.
Template tip: Keep a traditional text resume available. Skill bars should show evidence and a clear scale rather than decorative percentages.
How to choose an infographic template
Start with the information, not the image style. A template should fit your content, available space, and reader task. If the data needs comparison, a side by side grid will usually work better than a decorative timeline.
- Choose one primary message: The template should support that takeaway at a glance.
- Match the reading order: Vertical layouts suit scrolling pages. Square formats suit social feeds, while landscape layouts suit slides and reports.
- Check chart flexibility: Confirm that the template can show accurate labels, legends, units, and source notes.
- Plan for text length: A detailed explanation may need separate sections or a companion article.
- Keep brand elements restrained: Consistent fonts, colors, and spacing help, but decoration should not compete with the information.
Infographic format comparison
| Type | Shows | Common visual |
|---|---|---|
| Statistical | Quantitative findings | Charts and large numbers |
| Informational | Facts and concepts | Icons and labeled sections |
| Timeline | Chronological change | Dated sequence |
| Process | Ordered actions | Numbered flow |
| Geographic | Location based data | Map, legend, and labels |
| Comparison | Differences between choices | Columns and matching rows |
| Hierarchical | Levels and relationships | Pyramid or tree |
| List | A collection of items | Numbered cards or grid |
| Resume | Career profile | Timeline and skill labels |
Infographic template checklist
- Write the title and main takeaway before choosing a layout.
- Sort content into headings that match one of the nine formats.
- Place the most important finding where readers look first.
- Use a consistent grid, spacing, and visual hierarchy.
- Label all charts and include data sources near the relevant section.
- Use color with contrast and a secondary cue such as text or icons.
- Test the template at its target display and print size.
- Keep an editable source file for future updates.
Common questions
Which infographic type is easiest to create?
List and informational infographics are often the easiest starting points. The content can be grouped into consistent sections without complex data calculations or branched flows.
Can an infographic combine two types?
Yes. A timeline can include statistics, and a process can include a small comparison. The combination works when it still has a clear main message and a predictable reading order.
How do I know whether my content needs a chart?
Use a chart when relative size, distribution, trend, or comparison is important. If the reader only needs a fact or a definition, a concise label, icon, or short section is enough.
Should an infographic be vertical or horizontal?
Choose the format based on where it will be viewed. Vertical layouts suit long web articles and mobile scrolling. Horizontal layouts suit presentations, reports, and some print pages.
Bottom line
Simple takeaway
Match each infographic to its information: data uses statistics, locations need maps, events need timelines, and actions need process diagrams. A template is most useful when it supports that structure, keeps the message readable, and makes every source and label clear.