
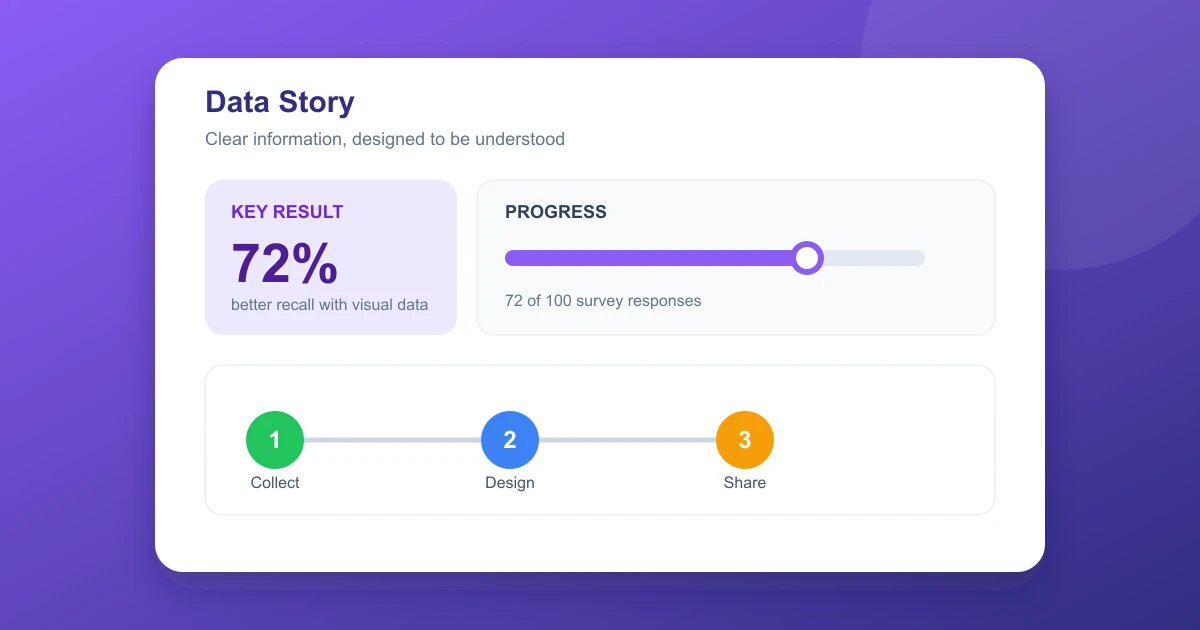
An infographic turns complex information into a visual story. It combines short text, numbers, illustrations, charts, icons, and layout to help an audience understand a topic quickly.
Quick answer
An infographic is a designed graphic that explains information using a clear visual hierarchy. The most effective examples use accurate data, concise copy, consistent colors, and one understandable reading path.
What is an infographic?
An infographic organizes information for fast reading and easy recall. It can summarize a report, explain a process, compare options, show trends over time, or visualize locations. Data visualization is one part of the format, but text and visual structure are equally important.
A useful infographic begins with a purpose. A reader should be able to state the main message after a quick scan. Supporting details then add context without repeating the same idea in several different forms.
Infographic examples
Statistical infographic
A statistical infographic uses charts, percentages, and large figures to summarize research. For example, a workplace report might show survey findings with bar charts, one or two key totals, and short observations.
Timeline infographic
A timeline shows changes or events in order. It works for product history, project milestones, historical periods, lesson plans, and annual summaries. The dates remain in a consistent sequence so the reader can follow time without guessing.
Process infographic
A process infographic explains sequential steps. Icons, numbered labels, arrows, and short instructions can show how to complete a task, apply for a service, prepare equipment, or track an onboarding workflow.
Comparison infographic
A comparison infographic places two products, ideas, categories, or audience groups side by side. Matching rows and consistent icons make the differences easy to spot.
Map infographic
A map infographic adds geographic context to statistics or patterns. It is useful for regional sales, travel routes, population data, and public resource coverage. Labels should stay close to the relevant area.
Popular types of infographics
| Type | Best use | Core visual |
|---|---|---|
| Informational | Explain a topic or concept | Icons and grouped sections |
| Statistical | Present survey or research data | Charts and prominent numbers |
| Timeline | Show events over time | Date markers and sequence line |
| Process | Teach ordered steps | Numbered cards or arrows |
| Comparison | Contrast choices | Columns and matching rows |
| Map | Add geographic context | Maps, pins, and legends |
Infographic templates
A template supplies dimensions, alignment, placeholders, a color palette, and chart styles. It is a starting point rather than a complete design. The selected content should determine the structure, not the other way around.
- Vertical report: Useful for long data summaries that scroll on a page.
- One page summary: Works for presentations, handouts, and executive updates.
- Social media: Fits square or portrait feed formats.
- Process flow: Uses numbered steps and directional arrows.
- Comparison grid: Aligns features, prices, or benefits in matching columns.
Before replacing template text, remove any decorative element that adds no meaning. A good template helps consistency while leaving room for accurate labels, sources, and readable spacing.
How to design an infographic
- Choose one audience and one central message.
- Collect accurate facts, source links, and measurement units.
- Write a short title and define the main takeaway.
- Create a simple outline and reading order.
- Choose a template that fits the information type.
- Sketch the chart or section layout before adding polished visuals.
- Add labels, sources, alt text, and a final date if relevant.
- Test the graphic on its intended screen and print sizes.
Infographic design tips
Lead with the conclusion. Put the most important message at the top or center. Supporting points should follow in a predictable sequence.
Use one clear visual hierarchy. Titles, section heads, labels, and body text should differ in size and weight. Repetition helps readers recognize related content.
Choose charts carefully. A bar chart works for category comparisons, a line chart works for trends, and a pie chart should contain only a small number of meaningful shares. Avoid decorative charts that distort scale.
Keep colors purposeful. Select a short palette with strong contrast. Do not use color alone to separate categories. Label color based groups and include patterns or icons when useful.
Make typography readable. Use one or two font families, maintain sufficient contrast, and leave at least 10 to 12 pixels of separation between close text elements. Long paragraphs do not belong in a small infographic.
Cite sources. Include source names, publication dates, units, and access details near the chart or in a footer. This protects credibility and gives readers a path to the original report.
Check accessibility. Test color contrast, add descriptive alt text for web images, and keep meaningful labels available in surrounding HTML or a linked document.
Infographic tools and file formats
Common infographic tools include Canva, Adobe Express, Visme, Piktochart, Figma, Illustrator, and PowerPoint. Some templates and exports require paid plans, while others offer free starter libraries.
Choose PNG for detailed web graphics, JPEG for compact images where transparency is unnecessary, PDF for printing, and SVG for scalable vector designs. Keep a separate editable master so text and charts can be corrected later.
Common questions
Does an infographic always contain a chart?
No. An infographic can rely on icons, illustrations, timelines, diagrams, or ordered text. A chart is appropriate only when numerical relationships need to be compared.
How much text should an infographic contain?
Use the shortest text that accurately communicates the point. Headings, labels, definitions, source notes, and a takeaway are usually enough. Move detailed paragraphs to a companion article or downloadable report.
What size should an infographic be?
Match the size to its destination. A social post often needs square or portrait dimensions, while a website article may use a vertical image. Print layouts need enough resolution and correct page margins.
How do you credit infographic sources?
Name the creator, list the original data source, include publication details, and add a date or version where appropriate. Avoid implying that a statistic belongs to a brand that only reproduced it.
Bottom line
Simple takeaway
Start with accurate information, one clear message, and a reading order that makes sense. Use a suitable template, restrained colors, readable charts, and visible source notes to create an infographic that is useful on screen or in print.